Introduction
Fire sprinkler systems are critical components of building safety, designed to control and suppress fires efficiently while minimizing damage and protecting lives. However, the demand for water flow and pressure in such systems creates challenges for both designers and building owners, including higher operating costs, more demanding infrastructure requirements, and potential inefficiencies. Reducing system demand, while maintaining fire suppression performance, is therefore an essential consideration in sprinkler system design.
This article is the first in a series exploring various strategies to reduce system demand in fire sprinkler systems while maintaining compliance with NFPA. In this initial study, the focus is placed on pipe sizing and its impact on flow rates and pressure requirements. Using a representative wet pipe sprinkler system with an OH2 hazard classification, the research evaluates the effect of upsizing pipes on system demand, with calculations performed at the base of the riser to quantify the results. The findings highlight pipe sizing as a critical design parameter that influences system efficiency, cost, and overall performance.
Project Definition
To evaluate the methods for saving fire sprinkler system demand, we consider a hypothetical example system. Below are the specific details of the example system, which will also be used in subsequent papers to evaluate the effects of other parameters on the system’s demand.
- Occupancy hazard classification : OH2
- Protected area : 200’ x 130’
- System type : Wet pipe
- Sprinkler type : Upright spray sprinklers, standard response, K5.6
- Sprinkler coverage : 13’ x 10’
- Pipe type : Black steel, Schedule 40
- Cross Main, Branch line, and sprinkler elevation : 9.5 feet
- Ceiling height : 10 feet
- Hose stream allowance : 250 gpm
- Branch line :
- 1 inch (for one sprinkler – Green)
- 1 ¼ inch (for two sprinklers – Blue)
- 1 ½ inch (for five sprinklers – Orange)
- Cross main and riser : 3 inches (Purple)
Figures 1 & 2 illustrate the project layout.
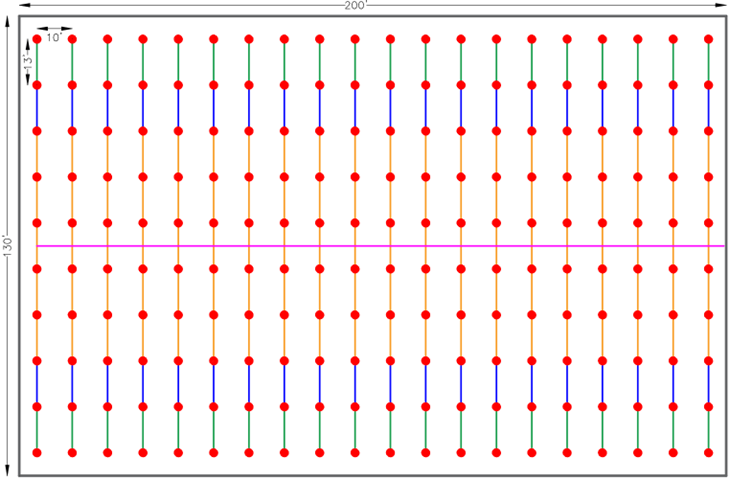
Figure 1- Project Layout (Plan View)
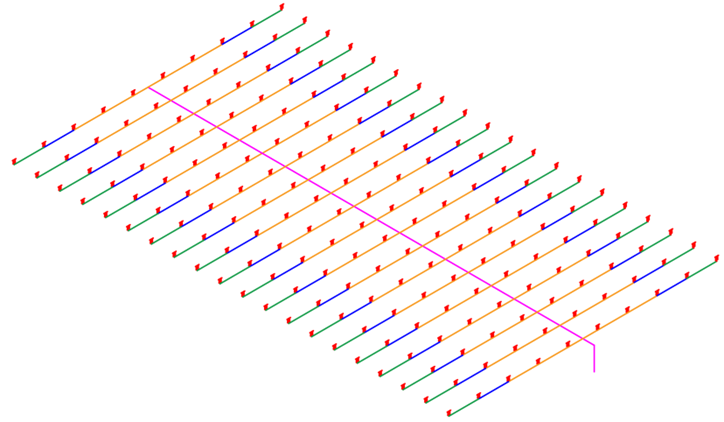
Figure 2- Project Layout (Isometric View)
Benchmark Design Parameters
The system design adopts Table 19.2.3.1.1 of NFPA 13 (2025 Edition) to define the density/area requirements. Key demand characteristics are based on the following parameters:
- Density : 0.2 gpm/ft²
- Design area : 1500 ft²
Figure 3 illustrates the design area configuration under this criterion.
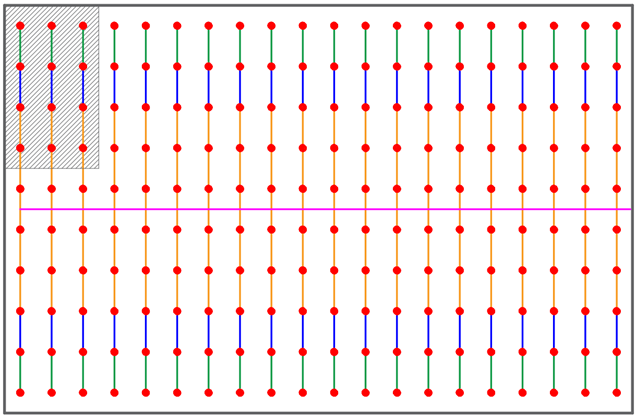
Figure 3- Design Area
Hydraulic calculations were performed at the base of the riser (BOR) to determine the system’s flow rate and pressure demands under baseline conditions. The analysis excludes pressure losses between the municipal city main and the riser base. The calculated values were:
- Flowrate : 592 gpm
- Pressure : 77.4 psi
These baseline values will be used as benchmarks to assess and compare the efficiency of alternative methods for saving system demand.
Pipe size
In most situations, increasing the size of the pipes is one of the solutions to decrease the pressure demand. According to the Hazen-Williams equation, the power of internal diameter is 4.87, so increasing the pipe diameter has a great impact on pressure loss. In our example, if we upsize the 1 ½ in pipes into 2 in, the system demand will be 589 gpm @ 65 psi.
The effect of upsizing is particularly pronounced in pipes where the velocity of water is high. Higher water velocity contributes to increased friction losses, and enlarging the pipe diameter helps mitigate these losses effectively. Consequently, focusing on upsizing high-velocity flow areas within the system can result in notable hydraulic efficiency gains.
The formula Q = A × V is fundamental in fluid dynamics and is used to calculate flow rate in a pipe or conduit system. In this formula:
Q - Represents the flow rate, measured in cubic feet per second (ft³/s or cfs) in this equation. In fire sprinkler systems, flow rates are often given in gallons per minute (gpm), which can be converted to cfs by multiplying by 0.002228.
A - Denotes the cross-sectional area of the pipe, typically expressed in square feet. The area can be calculated using the formula for the pipe’s circular cross-section: A = π × (D/2)², where D is the internal diameter of the pipe in feet.
V - Stands for the velocity of water, measured in feet per second (ft/s or fps), indicating how quickly water moves through the pipe.
This equation highlights the relationship between flow rate, pipe area, and water velocity. A larger pipe area (through upsizing) allows the system to accommodate the same flow rate at a lower velocity, reducing system pressure losses and improving efficiency. Conversely, reducing the area would require an increase in velocity to maintain the same flow rate, which could lead to higher friction losses and diminished performance. Understanding this balance is essential in optimizing fire sprinkler systems.
Example) Find the velocity of 30 gpm water in a 1-inch Schedule 40 pipe.
Given:
Flow rate ( Q ): 30 gallons per minute (gpm).
Internal pipe diameter ( D ): 1.049 inches, which converts to 1.049 ÷ 12 ft ≈ 0.08742 ft.
Step 1: Calculate the cross-sectional area ( A ) of the pipe:
The pipe has a circular cross-section, so the area is calculated using:
A = π × (D/2)²
Substitute D = 0.08742 ft:
A = 3.14 × (0.08742 / 2)² = 0.0060 ft²
Step 2: Convert Q to cubic feet per second (cfs):
To use the formula Q = A × V , the flow rate must be in cfs:
Q = 30 × 0.002228 = 0.06685 cfs
Step 3: Solve for velocity ( V ):
Rearrange the formula to find V :
Q = A × V => V = Q / A
Substitute Q = 0.06685 cfs and A = 0.00600 ft²:
V = 0.06685 ÷ 0.00600
V ≈ 11.14 ft/s
If the pipe is upsized to 1 ½ inches, the velocity of water flowing at 30 gpm will be reduced to approximately 4.73 ft/s.
Now, let's calculate the pressure loss of 30 gpm water in 1 and 1 ½” of pipe using the Hazen Williams equation.
PL = (4.52 × Q^1.85) / (C^1.85 × d^4.87)
In this formula:
PL - The pressure loss per unit length of pipe, measured in psi/ft. It represents the amount of pressure drop due to friction for every foot of pipe length.
Q - Flow rate, measured in gallons per minute (gpm). This is the rate at which water flows through the pipe and greatly influences the frictional losses.
C - Hazen-Williams roughness coefficient, which is a dimensionless number characterizing the internal roughness of the pipe. Higher C values indicate smoother pipes with less friction, whereas lower C values correspond to rougher pipes with greater frictional resistance. Typical values for C range from about 100 for older cast iron pipes to 150 for smooth plastic pipes (like PVC).
d - Internal diameter of the pipe, measured in inches. As explained before, the pipe diameter has a substantial impact on pressure loss—larger diameters reduce resistance, resulting in lower pressure losses, while smaller diameters increase resistance.
The system is assumed to be a wet pipe type, with a C factor of 120 for black steel pipe.
For a flow rate of 30 gpm in a 1-inch Schedule 40 pipe:
PL = 4.52 × (30^1.85) / (120^1.85 × 1.049^4.87) = 0.275 psi/ft
For a flow rate of 30 gpm in a 1 ½ -inch Schedule 40 pipe:
PL = 4.52 × (30^1.85) / (120^1.85 × 1.61^4.87) = 0.034 psi/ft
As demonstrated, the pressure loss in the 1-inch pipe (0.275 psi/ft), where the water velocity is 11.13 ft/s at a flow rate of 30 gpm, is approximately 8 times greater than that in the 1 ½-inch pipe (0.034 psi/ft), based on typical steel pipe assumptions. This significant difference highlights the impact of pipe upsizing on reducing velocity and pressure losses. By increasing the pipe diameter, the velocity of the flowing water decreases (e.g., to 4.73 ft/s in the 1 ½-inch pipe), leading to a substantial reduction in friction losses.
When Downsizing Pipes Reduces Sprinkler System Demand: A Counterintuitive Scenario
As we studied, increasing pipe size typically reduces pressure losses. However, there are unique situations where upsizing pipes can unexpectedly increase system demand. Consider the following example to illustrate this phenomenon.
Example) As shown in Figure 4, four sidewall sprinklers protect the most remote compartment in a residential building, designed per NFPA 13R. According to this standard, all four sprinklers must be included in the hydraulic calculations.
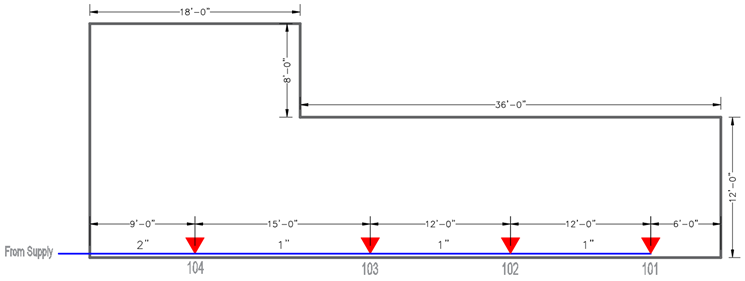
Figure 4- Most remote compartment and sprinkler arrangement
The Sprinkler datasheet is shown in Table 1.
| Sidewall Sprinkler K 4.4 | ||
|---|---|---|
| Coverage Area | Flow (gpm) | Pressure (psi) |
| 12’ × 12’ | 13 | 8.7 |
| 18’ × 20’ | 26 | 34.9 |
In Figure 4, Sprinkler 104 covers an area of 18 ft × 20 ft, while Sprinklers 101, 102, and 103 each cover 12 ft × 12 ft. The total pipe length from the water supply to Sprinkler 104 is 300 ft, including the equivalent length of fittings and valves. All pipes are CPVC, and the water supply provides a pressure of 50 psi. Hydraulic calculations indicate that the system requires 52.8 psi, which exceeds the available supply pressure of 50 psi, presenting a design challenge.
To solve this problem, first, we upsize 1 in pipes (between Sprinkler 101 and 104) to 2 in.
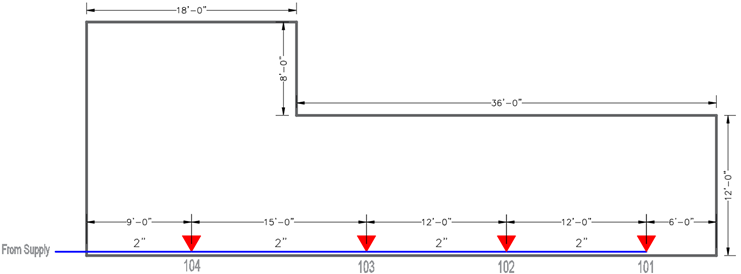
Figure 5- Upsizing the pipes from 1 in. to 2 in.
The hydraulic calculations show, surprisingly, that the required pressure increases to 57.8 psi. Why does this occur? Sprinkler 104, covering a larger area (18 ft × 20 ft), requires a higher pressure of 34.9 psi to achieve a flow rate of 26 gpm, as per the datasheet. In contrast, Sprinklers 101, 102, and 103, covering 12 ft × 12 ft, require only 8.7 psi for 13 gpm. Thus, Sprinkler 104 governs the hydraulic calculation, and the pressure at 101, 102, and 103 is influenced by the pressure needed at 104.
With the original 1-inch pipes, as explained in Annex A, the pressures and flow rates at the sprinklers are as follows:
- Sprinkler 101 : 22.03 psi & 20.65 gpm
- Sprinkler 102 : 22.89 psi & 21.05 gpm
- Sprinkler 103 : 26.07 psi & 22.47 gpm
- Sprinkler 104 : 34.9 psi & 26 gpm
After upsizing to 2-inch pipes, the reduced friction losses result in higher pressures at Sprinklers 101, 102, and 103, increasing their flow rates:
- Sprinkler 101 : 33.93 psi & 25.63 gpm
- Sprinkler 102 : 34 psi & 25.66 gpm
- Sprinkler 103 : 34.25 psi & 25.75 gpm
- Sprinkler 104 : 34.9 psi & 26 gpm
This demonstrates that the lower pressure loss in the larger pipes allows more pressure to be available at Sprinklers 101, 102, and 103, causing them to discharge more water. The total system flow increases from 90.17 gpm (with 1-inch pipes) to 103.04 gpm (with 2-inch pipes). This higher flow increases the pressure loss between the water supply and Sprinkler 104, resulting in a higher system demand of 57.8 psi.
Downsizing the Pipes: A Solution
Now, consider downsizing the pipes between the sprinklers 101 and 104 to 3/4-inch, as shown in Figure 6.
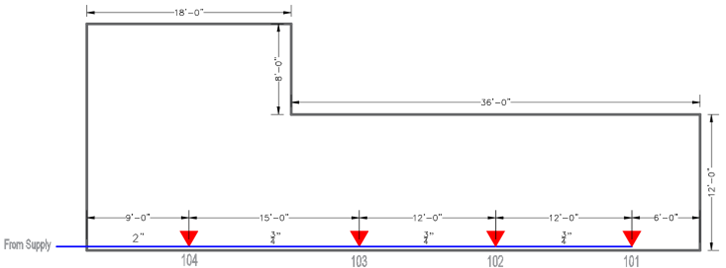
Figure 6- Downsizing the pipes from 2 in. to ¾” in.
Hydraulic calculations show that the system now requires only 47.7 psi, which is below the supply pressure of 50 psi. The pressures and flow rates at the sprinklers decrease as follows:
- Sprinkler 101: 11.31 psi and 14.8 gpm
- Sprinkler 102: 12.75 psi and 15.71 gpm
- Sprinkler 103: 18.24 psi and 18.79 gpm
- Sprinkler 104: 34.9 psi and 26 gpm
The total system flow decreases to 75.3 gpm. This reduced flow results in less pressure loss between the water supply and Sprinkler 104, lowering the overall system demand to 47.7 psi.
This example highlights a counterintuitive aspect of fire protection system design: in certain scenarios, downsizing pipes can reduce system demand by limiting the flow through non-governing sprinklers, thereby decreasing pressure losses in the main supply line. While this scenario was demonstrated using a residential sprinkler system, the principle applies more broadly. For instance, in systems with spray sprinklers where sprinklers are non-uniformly located—such as when the Sprinkler closest to the water supply covers a greater area, as seen with Sprinkler 104—the same dynamic can occur. In such cases, careful pipe sizing is critical to balance flow, pressure, and system demand, ensuring efficient and effective fire suppression across various sprinkler system designs.
Annex A: Calculations
In the design and analysis of fire sprinkler systems, hydraulic calculations often involve determining the flow rate of downstream sprinklers when the pressure at a specific node is known or has been calculated. This Annex explores various methods to address such scenarios, starting with a straightforward and commonly encountered example to illustrate the concepts.
Example Setup: Wet Pipe System (Refer to Figure 7)
Consider a wet pipe sprinkler system constructed with black steel Sch. 40 pipes, featuring a C Factor of 120. The system includes branch lines with a 1-inch diameter and a cross main with a 2-inch diameter. The design area comprises seven sprinklers, each with a K factor of 5.6. For this example, hydraulic calculations indicate that the pressure at Node A is 20 psi. To stay focused on the purpose of this Annex, we will not cover the process of determining Node A's pressure. However, if you are interested in learning more about this procedure, you can refer to another NSVCad publication, Hydraulic Calculations of Fire Sprinkler Systems with Excel File, available in the blog section of NSVsoft.net.
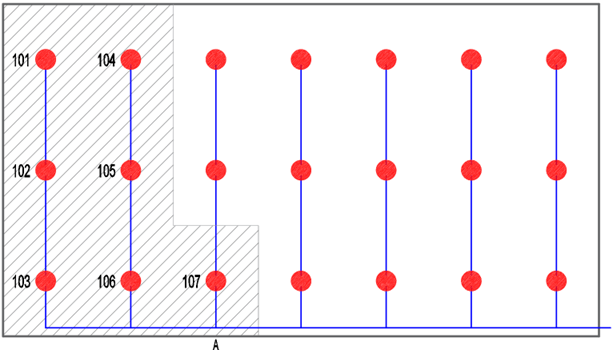
Figure 7- Determining the flow rate of sprinkler 107
Objective: Determining the Flow Rate of Sprinkler 107
In this example, the flow rate of Sprinkler 107 is directly influenced by the pressure at Node A. This section examines three distinct methods to calculate the flow rate of this sprinkler, providing a step-by-step breakdown of each approach for clarity.
Trial and error:
In this method, we begin by estimating the flow rate of Sprinkler 107. Using this initial guess, we calculate the pressure at the sprinkler, determine the pressure loss between Sprinkler 107 and Node A, and ultimately find the pressure at Node A. If the calculated pressure at Node A matches the predetermined value of 20 psi, the assumed flow rate is correct. Otherwise, we adjust the flow rate of Sprinkler 107 and repeat the process iteratively until the pressure at Node A converges to 20 psi. Below is a detailed walkthrough of the process:
Estimating the flow rate: At the first step, we guess sprinkler 107's flow rate is 15 gpm.
Calculating the sprinkler pressure: We calculate the pressure of sprinkler 107 based on its flow and K-factor.
Q = K × √P => P107 = (Q / K)² = (15 / 5.6)² = 7.17 psi
Calculating the node pressure: If we assume the length of the pipe between sprinkler 107 and node A is 5 ft, the pressure at node A will be calculated using the following formula.
PA = P107 + (PL107 to A × L107 to A)
In this formula:
PA - The pressure at node A, in psi.
P107 - The pressure at the sprinkler 107, in psi.
PL107-A - The pressure loss per unit length of pipe between sprinkler 107 and node A, measured in psi/ft. This value will be calculated using the Hazen-Williams formula.
L107 to A – The length of the pipe between sprinkler 107 and node A, in ft.
So:
PA = 7.17 + (4.52 × 15^1.85) / (120^1.85 × 1.049^4.87) × 5 = 7.55 psi
Comparing this value with the determined pressure of 20 psi reveals that our initial estimate was too low. In the next step, we increase the flow rate of sprinkler 107 and repeat the process.
Estimating the flow rate: 25 gpm.
Calculating the sprinkler pressure:
P107 = (25 / 5.6)² = 19.92 psi
Calculating the node pressure:
PA = 19.92 + (4.52 × 25^1.85) / (120^1.85 × 1.049^4.87) × 5 = 20.91 psi
We came close, but the second estimate was slightly higher than necessary. By repeating the process, we ultimately determine that the flow rate of sprinkler 107 is approximately 24.5 gpm.
Equivalent K Factor:
In this method, we begin by selecting an arbitrary flow rate for sprinkler 107 and determining its pressure. Next, we calculate the pressure at node A based on the selected flow rate and compute the equivalent K factor for the piping network linking sprinkler 107 to node A. Since the pressure at node A is already known, we can then determine the flow rate through this section of piping, leading to discharge from sprinkler 107.
Selecting an arbitrary flow rate for sprinkler 107: We choose 30 gpm.
Calculating the sprinkler pressure:
P107 = (30 / 5.6)² = 28.67 psi
Calculating the node pressure:
PA = 28.67 + (4.52 × 30^1.85) / (120^1.85 × 1.049^4.87) × 5 = 30.07 psi
Calculating the equivalent K Factor:
Q = Keq × √P => Keq = Q / √P = 30 / √30.07 = 5.47
Calculating the actual flow rate based on the available pressure at node A:
Q107 = Keq × √P = 5.47 × √20 = 24.5 gpm
As previously explained, the selection of the flow rate for Sprinkler 107 in this method is arbitrary. Now, let's explore the outcome if we choose a different value, such as 50 gpm.
Selecting an arbitrary flow rate for sprinkler 107: 50 gpm.
Calculating the sprinkler pressure:
P107 = (50 / 5.6)² = 79.72 psi
Calculating the node pressure:
PA = 79.72 + (4.52 × 50^1.85) / (120^1.85 × 1.049^4.87) × 5 = 83.26 psi
Calculating the equivalent K Factor:
Keq = Q / √P = 50 / √83.26 = 5.48
Calculating the actual flow rate based on the available pressure at node A:
Q107 = Keq × √P = 5.48 × √20 = 24.5 gpm
As observed, the rounded flow rate remains unchanged. However, this method is generally less accurate than the Trial-and-Error approach, and its precision depends on how closely the selected flow rate aligns with the actual flow of the sprinkler. For instance, choosing 500 gpm yields a less accurate result than selecting 20 gpm.
Numerical Solution:
In the first method, we presented the following formula:
PA = P107 + PL107 to A × L107 to A
Also, we know:
P107 = (Q / K)²
PL107 to A = (4.52 × Q^1.85) / (C^1.85 × d^4.87)
By combining all of these equations, we arrive at the following expression:
PA = (Q / K)² + (4.52 × Q^1.85) / (C^1.85 × d^4.87) × L107 to A
In the above formula, the values of PA , K , C , d , and L107 to A are known, therefore:
20 = (Q / 5.6)² + (4.52 × Q^1.85) / (120^1.85 × 1.049^4.87) × 5
20 = Q² / 31.36 + (4.52 × Q^1.85) / 8864.66 × 5
20 = Q² / 31.36 + 0.00255 × Q^1.85
627.2 = Q² + 0.079968 × Q^1.85
Solving this equation is challenging because it’s nonlinear and cannot be solved algebraically. It typically requires numerical methods, such as the Newton-Raphson method, which iteratively refines a solution, or using computational tools like MATLAB or Python (e.g., fsolve in SciPy) to solve it efficiently. These methods handle the complexity of nonlinear functions and provide accurate results. Using these methods, the solution for Q will be approximately 24.45 gpm.
The three methods—Trial and Error, Equivalent K Factor, and Numerical Solution—offer different ways to determine the flow rate of Sprinkler 107, each with unique strengths and limitations.
- Trial and Error : Simple but time-consuming, requiring multiple iterations for accuracy.
- Equivalent K Factor : Faster and simplifies modeling; however, if multiple sprinklers are present, this method provides the total flow rate rather than the flow of each individual sprinkler. It also relies on assumptions that may limit precision.
- Numerical Solution : Highly accurate and efficient, but requires technical expertise and computational tools.
Each method suits different scenarios based on complexity and available resources.
Flow Rate and Pressure Calculation for Sprinklers 101–104
Referring back to Figure 4, we will determine the flow rate and pressure of the sprinklers using the trial-and-error method. As previously noted, Sprinkler 104 is positioned closer to the water supply and requires higher pressure due to its coverage area. According to the datasheet, its pressure is 34.9 psi. We start by estimating the flow rate of Sprinkler 101. Using this initial guess, we calculate its pressure, determine the pressure loss between Sprinklers 101 and 102, and find the pressure at Sprinkler 102. Based on this value, we then compute the flow rate of Sprinkler 102. Following the same process, we determine the pressure and flow rate of Sprinkler 103, ultimately arriving at the pressure of Sprinkler 104. If the final pressure equals 34.9 psi, the initial estimate for Sprinkler 101 is correct. Otherwise, we adjust the first guess and repeat the steps.
1st guess: Q= 13 gpm
P101 = 8.73 psi => P102 = 9.10 psi => Q102 = 13.27 gpm => P103 = 10.45 psi => Q103 = 13.27 gpm => P104 = 16.59 psi
The calculated pressure at Sprinkler 104 (16.59 psi) is significantly lower than the required 34.9 psi, indicating that the initial flow rate estimate is too low. We need to increase the flow rate of Sprinkler 101.
2nd guess: Q= 22 gpm
P101 = 25.00 psi => P102 = 25.97 psi => Q102 = 22.42 gpm => P103 = 29.55 psi => Q103 = 23.92 gpm => P104 = 39.46 psi
The pressure at Sprinkler 104 (39.46 psi) is now slightly higher than required.
3rd guess: Q= 20 gpm
P101 = 20.66 psi => P102 = 21.48 psi => Q102 = 20.39 gpm => P103 = 24.47 psi => Q103 = 21.77 gpm => P10
4th guess: Q= 20.65 gpm
P101 = 22.03 psi => P102 = 22.89 psi => Q102 = 21.05 gpm => P103 = 26.07 psi => Q103 = 22.47 gpm => P104 = 34.90 psi
By iteratively adjusting the flow rate of Sprinkler 101 using the trial-and-error method, we determined that a flow rate of 20.65 gpm yields the correct pressure at Sprinkler 104 (34.90 psi).
References:
National Fire Sprinkler Association, NFSA.: 2022. Layout, Detail, and Calculation of Fire Sprinkler Systems: 3rd Edition Layout Technician Pathway Courses


No comments yet. Be the first to share your thoughts!